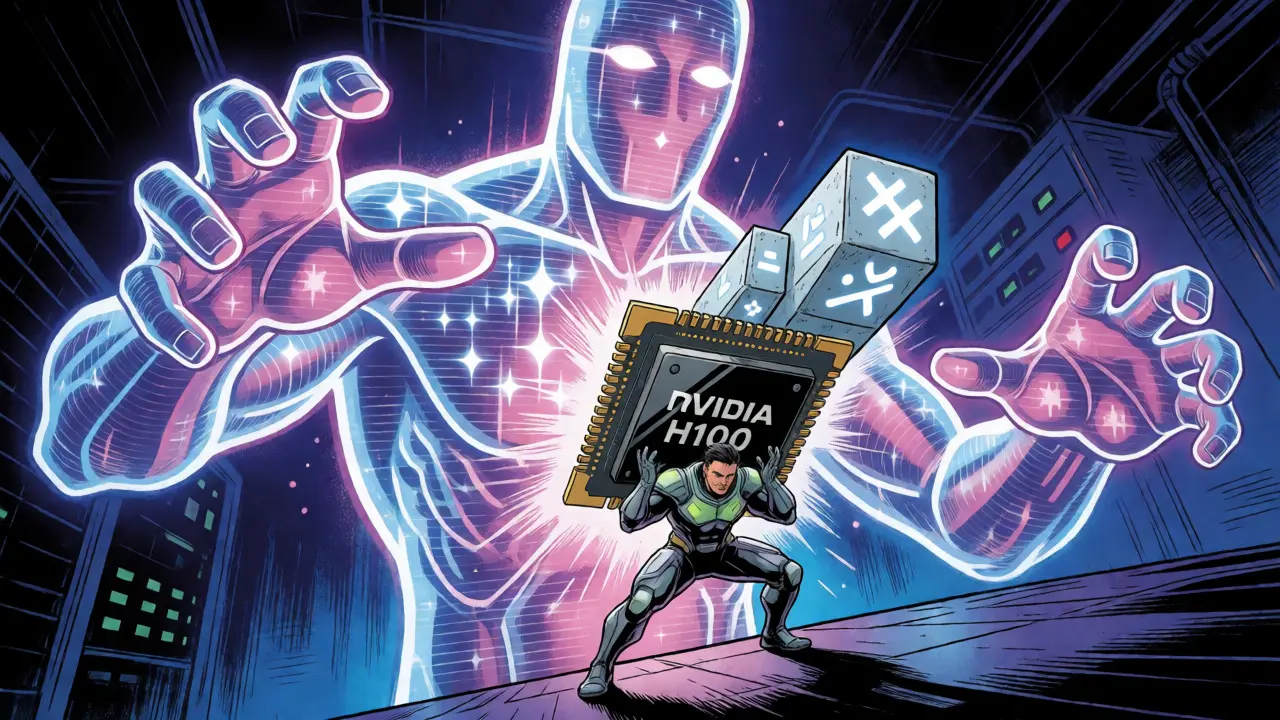
You’ve probably heard the hype about Large Language Models (LLMs) having trillions of parameters. But have you ever wondered how anyone actually trains a model that’s too big to fit in the memory of even the most powerful graphics card? It’s not magic; it’s an engineering feat called distributed training. This process splits the massive workload across thousands of GPUs, requiring precise orchestration to keep them talking to each other without bringing the whole system to a crawl.
If you’re building or managing AI infrastructure, understanding this isn’t just academic-it’s critical for your budget and timeline. A poorly configured cluster can waste up to 70% of its compute power just moving data around. Here is what you need to know about orchestrating thousands of GPUs effectively.
The Memory Wall and Why Single GPUs Fail
Let’s start with the core problem. Modern LLMs like Llama 3 or GPT-4 have billions, sometimes trillions, of parameters. A single NVIDIA H100 GPU has 80GB of high-bandwidth memory. Sounds like a lot, right? It’s not. When you factor in the model weights, optimizer states, gradients, and activation values needed for backpropagation, a 70-billion parameter model alone requires hundreds of gigabytes of memory. You simply cannot fit it on one chip.
This is where distributed training enters the picture. Instead of trying to force the entire model onto one device, we spread it out. The goal is to maximize hardware utilization while minimizing the time spent waiting for data transfers. According to recent studies, including work from arXiv in late 2024, improper configuration doesn't just slow things down; it can render expensive hardware nearly useless due to communication overhead.
Three Pillars of Parallelism
To split the work, engineers rely on three main strategies. Most modern large-scale training runs use a hybrid of all three, often referred to as 3D parallelism.
- Data Parallelism: This is the easiest concept to grasp. Each GPU holds a full copy of the model but processes a different batch of data. After processing, they average their gradients. It works great for smaller models but hits a wall when the model itself exceeds GPU memory.
- Tensor (Model) Parallelism: Here, we slice individual layers of the neural network across multiple GPUs. If a layer has a huge matrix multiplication, we split that matrix among several devices. They compute their part simultaneously and then combine results. This reduces memory per GPU but increases communication frequency significantly.
- Pipeline Parallelism: Think of this as an assembly line. Different GPUs handle different stages of the model’s forward and backward passes. While one GPU computes the first few layers, another handles the last few. The tricky part here is "pipeline bubbles"-idle time where GPUs wait for inputs from previous stages.
NVIDIA’s research shows that naive implementations of these strategies can be inefficient. Their Alpa framework, for example, uses dynamic programming to find the optimal balance between tensor and pipeline parallelism, achieving up to 3.2x faster training than standard methods by reducing scheduling overhead.
The Communication Bottleneck
Here is the harsh reality: adding more GPUs does not linearly increase speed. In fact, beyond a certain point, adding more cards can actually make training slower if your interconnects aren't fast enough. The primary culprit is communication overhead.
When GPUs need to share gradient updates, they use protocols like NCCL (NVIDIA Collective Communications Library). On a single node, GPUs talk via NVLink, which offers blazing speeds of 900GB/s. But when you scale across multiple servers, you rely on InfiniBand networks, which are slower (around 400GB/s). As you add more nodes, the traffic patterns become complex. Ring-allreduce algorithms, commonly used for gradient synchronization, require each GPU to communicate with its neighbors. At scales exceeding 16,384 GPUs, the study noted that each additional GPU contributes less than 0.1% to overall throughput because the network becomes saturated.
| Connection Type | Bandwidth | Use Case | Latency Impact |
|---|---|---|---|
| NVLink (Intra-node) | 900 GB/s | Tensor Parallelism within a server | Very Low |
| InfiniBand HDR/NDR | 200-400 GB/s | Inter-node communication | Moderate |
| Ethernet (RoCEv2) | 100-200 GB/s | Cost-effective clusters | High |

Hardware Choices Matter More Than You Think
Not all cloud providers offer the same performance for distributed tasks. You might think picking the cheapest GPU hour is the smart move, but for large-scale LLM training, network topology is king.
Google Cloud’s A3 series machines, equipped with NVIDIA H100s, are specifically designed with strong GPU-to-GPU bandwidth, making them ideal for heavy tensor parallelism. AWS SageMaker offers robust tools but often requires careful tuning to avoid fitting issues where the model and a single data record must fit on one device-a constraint that limits extreme scalability. Meanwhile, specialized providers like Runpod have gained traction by offering cost savings of 40-60% compared to hyperscalers, though users report needing more hands-on expertise to manage the Kubernetes orchestration required for stability.
A key consideration today is the shift to NVIDIA H200 GPUs. With 141GB of HBM3e memory, they alleviate some of the pressure on tensor parallelism, allowing larger chunks of the model to reside on fewer devices. However, the fundamental physics limit remains: bandwidth cannot keep up with compute forever.
Debugging the Black Box
If you’ve ever tried to debug a distributed job, you know the pain. Unlike single-GPU training, where errors are usually obvious, distributed failures are often silent or cryptic. Google Cloud engineers report that 60-70% of distributed training failures stem from communication deadlocks rather than actual code bugs.
A deadlock happens when two GPUs are waiting for each other to send data, creating a stalemate. These issues are hard to reproduce because they depend on timing and network load. Common pitfalls include:
- Network Topology Mismatches: Placing GPUs on different network switches than intended can cause unexpected latency spikes.
- Memory Fragmentation: Over time, allocating and freeing tensors can fragment GPU memory, causing out-of-memory errors even when there seems to be space available.
- Synchronization Drift: If one worker falls behind due to a slow disk read or CPU spike, the entire pipeline stalls.
Tools like PyTorch’s FSDP (Fully Sharded Data Parallel) and DeepSpeed help mitigate these issues by automatically managing sharding and offloading, but they require deep configuration knowledge. One engineer documented spending three months optimizing a Llama 2-70B run to achieve 92% hardware utilization, highlighting that software tuning is just as important as hardware selection.

Scaling Laws and Diminishing Returns
Chinchilla scaling laws tell us that to get better performance, you need both more data and more parameters. But there’s a catch in the infrastructure world. Research indicates that scaling efficiency drops below 50% once you pass 8,192 GPUs, regardless of how clever your parallelization strategy is. The cost of coordinating thousands of devices outweighs the benefit of extra compute.
This has led to new approaches like "modular training," proposed by DeepMind, where components are trained separately and then integrated. This bypasses some communication hurdles. Additionally, techniques like communication compression are becoming standard, with analysts predicting that by 2027, nearly half of all distributed workloads will use some form of compression to reduce data transfer sizes.
Practical Takeaways for Engineers
If you are planning a large-scale training run, keep these heuristics in mind:
- Start Small, Scale Smart: Don’t jump straight to 1,000 GPUs. Validate your pipeline on 8 or 16 GPUs first. Check for memory leaks and synchronization issues before committing to a massive cluster.
- Monitor Network Metrics: Watch your NVLink and InfiniBand utilization closely. If your GPUs are idle while waiting for data, your network is the bottleneck, not your compute.
- Choose the Right Framework: For ease of use, PyTorch FSDP is excellent. For maximum control and optimization, consider DeepSpeed or JAX-based solutions like Alpa.
- Budget for Engineering Time: Configuring distributed systems takes weeks, not hours. Factor in the cost of specialized expertise, especially for debugging deadlocks.
Distributed training is no longer optional for serious AI development. It’s the backbone of modern LLM progress. While the challenges of communication overhead and debugging complexity are real, the ability to train models that were previously impossible makes the effort worthwhile. Just remember: more GPUs don’t always mean faster training. Sometimes, smarter orchestration wins every time.
What is the difference between data parallelism and model parallelism?
Data parallelism replicates the entire model on each GPU, with each GPU processing a different subset of the data. Model parallelism splits the model itself across multiple GPUs, so each GPU holds only a portion of the model's layers or parameters. Data parallelism is easier to implement but limited by GPU memory size, while model parallelism allows training of models larger than a single GPU's memory but introduces higher communication costs.
Why do I experience diminishing returns when adding more GPUs?
Diminishing returns occur because of communication overhead. As you add more GPUs, they must exchange more data to synchronize gradients. Eventually, the time spent sending and receiving data across the network exceeds the time saved by splitting the computation. Studies show that beyond 8,192 to 16,384 GPUs, the network becomes the bottleneck, causing scaling efficiency to drop significantly.
Which interconnect technology is best for distributed training?
For intra-node communication (GPUs within the same server), NVLink is superior due to its high bandwidth (up to 900GB/s). For inter-node communication (between servers), InfiniBand is generally preferred over Ethernet for high-performance computing due to lower latency and higher throughput. However, newer RoCEv2 Ethernet standards are closing the gap for cost-sensitive deployments.
How do I debug a distributed training hang?
Hangs are often caused by deadlocks where workers wait indefinitely for collective operations. Use tools like PyTorch's flight recorder or NVIDIA's Nsight Systems to trace execution. Check for mismatched collective calls (e.g., one rank calling `all_reduce` while another calls `broadcast`) and ensure that network interfaces are correctly bound. Logging timestamps for key synchronization points can also help identify which rank is lagging.
Is it cheaper to use specialized cloud providers like Runpod or Lambda Labs?
Yes, specialized providers often offer 40-60% cost savings compared to major hyperscalers like AWS or Google Cloud for equivalent GPU instances. However, they may lack enterprise-grade support and advanced managed services. You will likely need to invest more engineering time into setting up and maintaining the Kubernetes clusters and networking configurations yourself.



Joanna Mucha
September 3, 2026 AT 23:17The sheer hubris of trying to orchestrate silicon like a symphony while ignoring the fundamental entropy of network latency is truly tragic
We are building cathedrals on sand, pretending that more compute power can outrun the speed of light itself. It is not just engineering; it is a philosophical failure to accept limits
Meagan Mueller
September 4, 2026 AT 11:32theyre hiding the real bottleneck its not just bandwidth its the switch firmware backdoors slowing everything down nobody talks about this
i bet big tech knows but wont admit it because they want us buying more cards instead of fixing the stack
Kim Edwards
September 5, 2026 AT 16:12OH MY GOD THIS IS SO PAINFUL TO READ
I remember when my cluster crashed at 3 AM and I thought I was going to lose my mind
The silence of a deadlocked GPU is louder than any scream
It haunts you forever
Bonnie Watt
September 5, 2026 AT 23:48Everyone thinks they know distributed systems until their job hangs for six hours and they realize they don't understand collective operations at all
Most people just copy paste configs from GitHub and pray it works which is basically gambling with million dollar hardware
If you haven't spent weeks debugging NCCL timeouts you have no right to call yourself an expert in this field
Elisabeth Ballet
September 7, 2026 AT 06:46Listen up team because this is crucial for our next sprint planning
We need to stop treating infrastructure as an afterthought and start respecting the physics of data movement
Every single engineer needs to understand why pipeline bubbles happen and how to mitigate them before we scale further
This isn't just about running faster it's about saving our budget and our sanity
Let's commit to monitoring those interconnect metrics religiously starting now
We can do this if we stay disciplined and focused on the actual bottlenecks rather than just throwing GPUs at the problem
Go out there and optimize those pipelines!
Brenna Gonedrman
September 7, 2026 AT 07:50Actually the article misses the point completely about memory fragmentation
It happens constantly and ruins efficiency
You need to defragment manually or use specific allocators
Otherwise your 80GB card acts like a 40GB card half the time
Simple fact ignored by most tutorials
End of story
Courtney Wagstaff
September 7, 2026 AT 13:23honestly though the vibe here is pretty chill
just take it one node at a time fam
don't let the big numbers scare you off
start small and let the system breathe
it’s like gardening you gotta water the roots before expecting flowers
keep it cool and steady wins the race
tiffany King
September 7, 2026 AT 14:16This is such a fantastic overview of a complex topic! It really helps demystify what goes on behind the scenes when training these massive models.
The part about starting small and scaling smart is especially good advice for anyone new to the field. We often get so excited about the potential that we forget to validate our setup first.
Knowing that communication overhead is the real enemy changes how you look at every configuration choice. It’s empowering to know that smarter orchestration beats brute force every time.
Thanks for sharing this valuable insight!