You’ve probably heard the horror stories. A team hits 99.99% uptime, their latency is pristine, and they’re celebrating a perfect quarter. Then, six months later, they can’t ship a simple feature update without breaking three other things. Why? Because they optimized for stability today but ignored maintainability for tomorrow. Service Level Objectives (SLOs) are traditionally used to track availability and speed, but they fail to capture how hard it is to change your system. That’s where maintainability SLOs come in. They measure the friction of code changes, not just the output of running servers.
If you’re an engineering leader or SRE, you know that reliability isn’t just about keeping the lights on; it’s about keeping the lights easy to fix. Google’s Site Reliability Engineering (SRE) practices, established around 2003, focused heavily on operational metrics. But recent data shows a gap. According to Nobl9’s 2023 report, only 32% of organizations have implemented specific maintainability-focused SLOs, even though 78% agree they matter. This article breaks down exactly which indicators to track, how to set realistic targets, and why your current alerting strategy might be missing the biggest risk to your product’s longevity.
Why Traditional SLOs Miss the Maintainability Gap
Standard SLOs are great at answering "Is the site up?" and "Is it fast?" They are terrible at answering "Can we safely change this code?" When you only track availability, you incentivize teams to freeze features and avoid risky refactors. This creates technical debt that compounds silently until a small change causes a massive outage.
Maintainability SLOs shift the focus from runtime performance to development efficiency. Instead of measuring how long a request takes, you measure how long it takes to deliver value. For example, a standard SLO might say "95th percentile response time under 200ms." A maintainability SLO would say "Mean Time to Recovery (MTTR) under 1 hour" or "Pull Request Cycle Time under 24 hours." These metrics directly correlate with business outcomes. Sedai’s analysis of 1,200 engineering teams found that organizations with formal maintainability SLOs resolved incidents 47% faster than those without them.
| Feature | Operational SLOs | Maintainability SLOs |
|---|---|---|
| Primary Focus | System Uptime & Latency | Change Velocity & Safety |
| Key Metric Example | 99.9% Availability | < 2 Days Lead Time |
| Error Budget Use | Freeze releases if budget exhausted | Pause feature work if quality drops |
| Measurement Window | 28 days or Quarterly | 7-14 days (for rapid feedback) |
Top Indicators for Measuring System Health
You don’t need to track everything. In fact, trying to do so leads to noise. Start with three core Service Level Indicators (SLIs) that map directly to the DORA metrics framework, which has become the industry standard for high-performing engineering teams.
- Deployment Frequency: How often does code go to production? Elite performers deploy multiple times per day. If your target is weekly deployments and you drop to monthly, your maintainability is slipping.
- Change Failure Rate: What percentage of deployments cause a failure requiring hotfixes? A healthy target is under 5%. If this spikes, your tests or review processes are failing.
- Mean Time to Recovery (MTTR): How long does it take to restore service after a failure? The goal here is predictability. If MTTR creeps up from 30 minutes to 4 hours, your observability or runbooks are likely outdated.
Another critical indicator is Pull Request Cycle Time. This measures the time from opening a PR to merging it. Long cycle times often indicate complex dependencies or poor test coverage. Setting an SLO here-say, under 24 hours-forces teams to keep changes small and reviews efficient. It prevents the "big bang" merge that often introduces subtle bugs.
Setting Realistic Targets and Error Budgets
Here’s where many teams stumble. They copy-paste targets from big tech companies without adjusting for their context. Just because Netflix deploys thousands of times a day doesn’t mean your B2B SaaS startup should aim for the same frequency immediately. You need baselines.
Start by analyzing six months of historical data. If your average deployment frequency is twice a week, setting a target of daily deployments is a recipe for burnout. Instead, aim for a modest improvement, like moving from bi-weekly to weekly deployments over a quarter. Once you have a baseline, define your error budget. Unlike availability, where 99.9% is a clear line, maintainability budgets require calibration. One engineering director found that allowing a 15% rate of "changes requiring follow-up fixes" was acceptable for their team after reviewing half a year of post-mortems.
Remember the warning from Dr. Nicole Forsgren, author of *Accelerate*: optimizing solely for deployment frequency without corresponding reliability metrics leads to higher incident rates. Balance is key. If you push deployment frequency too hard while ignoring change failure rates, you’ll just ship more broken code faster.
Designing Alerts That Actually Help
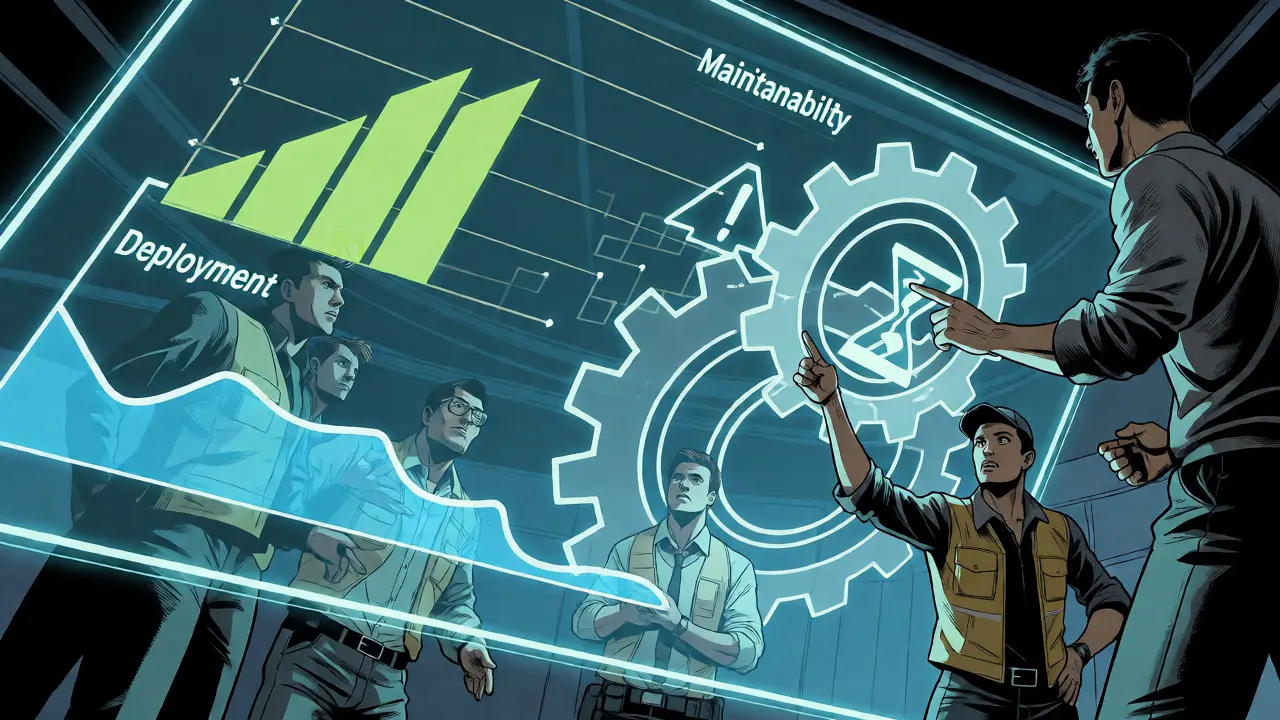
Alert fatigue is real. If every minor dip in deployment frequency wakes someone up at 3 AM, nobody will care when it matters. Splunk’s 2024 guide notes that 68% of successful implementations use multi-window burn rate alerts. This means you watch both short-term spikes and long-term trends.
For maintainability, consider these alerting strategies:
- Symptom-Based Alerts: Alert on "Increased Rollback Frequency" rather than "High Cyclomatic Complexity." Engineers can’t fix complexity instantly during an incident, but they can react to rollbacks.
- Cooldown Periods: Implement 24-72 hour cooldowns for non-critical maintainability alerts. This prevents noise during planned maintenance windows or major refactor sprints.
- Burn Rate Thresholds: Set a 6-hour window for critical issues (e.g., sudden spike in failed builds) and a 72-hour window for gradual degradation (e.g., slowly increasing lead time).
A common mistake is tracking vanity metrics. AWS Principal SRE Sarah Chen warns against tracking "lines of code changed." It tells you nothing about quality. Instead, track the "percentage of changes that don’t require follow-up fixes." This is actionable, user-centric, and directly tied to maintainability.
The Business Case: Connecting Code to Customer Value
Why should your CFO care about maintainability SLOs? Because they directly impact customer satisfaction. Vivantio’s 2024 study found that organizations tracking feature lead time as an SLI showed 28% higher customer satisfaction scores. Customers don’t care about your uptime if you can’t deliver the features they asked for last month.
Maintainability SLOs also reduce engineer burnout. A principal engineer at a financial services firm reported that setting an SLO for MTTR under 45 minutes reduced burnout by creating predictable work patterns. Instead of constant firefighting, the team knew exactly what "good" looked like and could plan their capacity accordingly. This predictability allows for better resource allocation and less stress during release cycles.
However, misalignment is a risk. A case study by the DevOps Institute noted a 40% increase in project delays when maintainability SLOs were implemented without cross-functional agreement. Product managers might feel pressured to cut scope to meet cycle time targets, leading to incomplete features. Ensure your SLOs reflect what the business actually values, not just what engineers find easy to measure.

Implementation Roadmap for Teams
Don’t try to boil the ocean. Follow a phased approach to adoption:
- Phase 1: Setup (Weeks 1-4): Define your top 3 SLIs. Keep it simple. Connect your CI/CD pipeline and version control data sources.
- Phase 2: Integration (Weeks 5-12): Build dashboards. Integrate with your incident management platform. Establish baselines and initial targets.
- Phase 3: Operationalization (Months 3-6): Turn on alerts. Start using error budgets to pause feature work when quality drops. Review weekly.
- Phase 4: Refinement (Ongoing): Adjust targets based on actual performance. Expand to additional metrics if needed.
Tools matter here. Dedicated SLO platforms like Nobl9 or Blameless score significantly higher (4.2/5) for maintainability support compared to generic monitoring tools (3.1/5). They offer pre-built integrations with GitHub, GitLab, and Jenkins, saving you weeks of custom scripting.
Frequently Asked Questions
What is the difference between an SLO and an SLI?
An SLI (Service Level Indicator) is the actual measurement, such as "the number of successful deployments this week." An SLO (Service Level Objective) is the target you set for that measurement, such as "we aim for at least 15 successful deployments per week." The SLO defines the expectation; the SLI provides the data to check against it.
How do I choose the right maintainability metrics for my team?
Start with the DORA metrics: Deployment Frequency, Change Failure Rate, Mean Time to Recovery, and Lead Time for Changes. Choose the one or two that currently hurt your team the most. If you’re shipping too slowly, focus on Lead Time. If you’re breaking things often, focus on Change Failure Rate. Don’t track more than three initially to avoid overwhelming your dashboard.
Should maintainability SLOs trigger page alerts?
Generally, no. Page alerts are best reserved for immediate user-facing outages (availability). Maintainability issues usually degrade service gradually. Use ticket-based alerts or Slack notifications for maintainability breaches. Only page if a maintainability issue directly causes a severe production incident, such as a rollback storm that impacts users.
What happens when we exhaust our maintainability error budget?
When you exhaust the budget, you stop shipping new features and focus on fixing the underlying issues causing the breach. For example, if your Change Failure Rate exceeds its SLO, you halt feature releases and dedicate engineering time to improving test coverage or refactoring unstable modules. This ensures technical debt doesn’t accumulate indefinitely.
Are maintainability SLOs relevant for small startups?
Yes, but scale them appropriately. Small startups might not need complex dashboards. Simply tracking "time from commit to production" and "number of rollbacks per week" manually can provide valuable insights. As you grow, automate these metrics. Early attention to maintainability prevents the technical debt spiral that often plagues scaling startups.